Introduction to Debugging
Author: Russell JohnsonGetting good at debugging is one of those things that comes with experience. It helps to have a general idea of what tools (beyond simple printf() statements) that are available to you in heavyweight IDE’s like Visual Studio and CLion. In this blog post we will go over the basics that Community (free) edition of Visual Studio provides.
Breakpoints
Yes the breakpoint, elegant and simple to use. To create one all you need to do is click on the bar to the left of the line number (see Figure 1). When the execution of the program gets to this line, the program will stop and a yellow arrow will appear inside (Figure 2).

Figure 1. A basic breakpoint was set on line 32.

Figure 2. The breakpoint has been reached.
The yellow arrow signifies that the line will be the next one to be executed. Using the hotkeys F10 (step over) and F11 (step into) or the corresponding buttons at the top of Visual Studio you can move the execution forward. If this line was a function, Step Into would move the arrow and your cursor to the first line of that function, hence Step Into. Step Over executes that line and moves to the next. If the arrow is at the end of the current function, it goes back to the calling function, and so on.
Pressing F5 or clicking on the continue button at the top will resume the program’s normal execution.
Hovering over variables while the execution is stopped will show the variable’s current value. If you have an expression (say adding something together), highlighting that expression then hovering over it will show the result.
You can disable breakpoints temporarily by hovering your mouse over the breakpoint, then selecting the disable button. This breakpoint will change to a non-solid circle (Figure 3) and will not work unless re-enabled. All breakpoints in the solution can be enabled/disabled/deleted at the same time from the Debug menu at the top.

Figure 3. The breakpoint at line 32 has been disabled.
Breakpoints are local to your machine only. Uploading your project to the source control doesn’t share your set breakpoints.
Breakpoints will act weirdly when in Release mode. This is intentional behavior and is the result from the compiler adding optimizations and removing debugging symbols from the program. To aid in debugging the compiler will add extra hints inside the binary when compiled in Debug mode, this takes up more memory, but makes the debugger work so the tradeoff is usually good. There is a way to get the compiler to do the Release optimizations and provide the debugging info inside the binary, but that is beyond the scope of this current post.
If your program did not stop at that breakpoint, then your function didn’t get called. The most common cause of this is that you didn’t call the function that you just made. It happens to the best of us. Another cause is that your function is behind an if statement, and that if’s condition is not what you expected.
Conditional Breakpoints
You can set conditions for when your breakpoint will trigger. Hovering over the breakpoint and then selecting the cog that appears will show the Breakpoint Settings window (Figure 4). Selecting the Conditions checkbox will allow you to specify conditions for this breakpoint. Every time this breakpoint is reached, then the condition is checked and triggered if the conditions are met. At the time of writing, you have three options, Conditional Expression, Hit Count and Filter.

Figure 4. The Breakpoint Settings menu.
Conditional Expression is used to allow you to write a boolean expression that is compiled then tested each time the breakpoint is hit. You can use local variables that this breakpoint can see, but you usually can’t call functions. Defines and macros cannot be used as well. This means the C definition of NULL cannot be used, so you must use 0. For example, to add a condition that foo must be NULL for the breakpoint to be triggered we use this Conditional Expression: foo == 0.
Hit Count is useful when dealing with any kind of loop. Sometimes your for loop breaks later on and we can use Hit Count to stop after the first number of times the breakpoint is hit. You can also specify multiples of the number or bigger than. You can easily replicate this with a Conditional Expression, but if you are debugging a while loop and don’t want to add an int to track how many times the loop has been run, Hit Count is useful.
Filter is not commonly used outside of multi-threading. If you have multiple threads and you need to debug only one thread, then this is useful. Otherwise, you will have the breakpoint being triggered multiple times while you are stepping through a single thread’s code.
Data Breakpoints
Data Breakpoints are very useful whenever you are dealing with heap allocated memory. This allows you to see when an area of memory is written too but it comes with some caveats. Data breakpoints do not work if you are using shared process memory, or memory that is edited by the Windows Kernel, for example reading in a string from a file (you will learn why this happens in CS180). Generally, for your Game Projects you will not need to worry much about this so Data Breakpoints are still good to use.
To create a Data Breakpoint, use the Debug > New Breakpoint > Data Breakpoint menu while the execution of the program is stopped. In the window that appears, enter the expression that evaluates to the area of memory you wish to watch. You can watch from 1 to 8 bytes of data. Conditions can also be placed on this breakpoint (see Conditional Breakpoints for more information).
Note you need to be careful about where the memory you want to watch is located. If the variable you watch is on the stack, as soon as the function returns that area of memory can be used differently, causing your breakpoint to trigger randomly. If you are watching the heap then you don’t have to worry about it unless you free this memory.
Call Stack Window
When the execution of the program is stopped, the Call Stack window (Figure 5) shows the current chain of functions that lead to where the program is stopped. Double clicking on any line will move your cursor to that function, showing the local variable of that function as well. The grey arrow (Figure 6) shows what call leads to the currently executing function.

Figure 5. The Call Stack window show the current function call stack.

Figure 6. On line 138 leads to a function higher on the execution stack.
Call Hierarchy
Right clicking a function name and selecting View Call Hierarchy will bring up a new window (Figure 7) that shows what functions call the selected function, as well as what function calls are called by the selected function. Selecting another function will not clear the window, so you can use this to explore around a code base with ease.

Figure 7. The Call Hierarchy window shows calls made and calls to a given function.
Debugging Examples
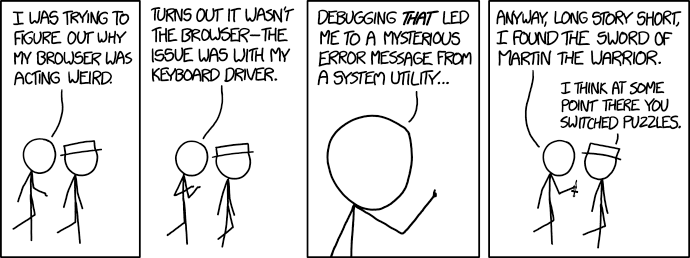
XKCD: https://xkcd.com/1722/
Now that we know some basic tools, let’s look at some debugging problems I have helped with, and what tools/methodologies that I used when debugging.
Case Study #1
Just this week I was helping a freshman debug their CS230 assignment. His program would randomly crash, and if he switched from level 1 to level 2 it would crash when he called free() on some memory that he allocated previously, complaining about that Heap Corruption was detected.
Since we have Visual Studio telling us there was Heap Corruption my first thought was that there was a use after free() happening somewhere in the Level 1 code. The triggering free() call was happening in the SpriteFree(), so I used the Call Hierarchy window to walk from SpriteFree() all the way up and verify that the pointers were not being copied anywhere and the pointer was being set to NULL when it was freed. No dice.
My next thought was that the GameStateManager was calling the Update for Level 1 after it was switched to Level 2, but the GameStateManager code was correct.
Then I thought we should look at every place that was allocating memory (calls to calloc()) and see if there is anything wrong with those. After checking the GameObject, and all other components we found this beauty:
SpritePtr spriteComponent = calloc(1, sizeof(spriteComponent));
Instead of allocating enough memory for the struct (sizeof(struct Sprite)) he was only allocating the size of a pointer. The Sprite struct was definitely bigger than a 32 bit pointer. Fixing that solved the random crashing and heap corruption and they could continue working on their assignment.
Case Study #2
Also this past week, two different CS230 students approached me that their mesh would not render, no matter what they did. Off the top of my head, I gave them some steps of debugging they should try:
- Change the background from white to black (or vise versa) to make sure what you are trying to draw was not all white or all black.
- Check your transform code and see if the inputs to that
SetTransform()function is correct. - Try hard coding known good values to
SetTransform(), something in the center of the screen, with 200 wide values for the width and height. - Compare your drawing code to the CS230 demo project that was provided at the beginning of the semester.
Both students got back to me that during step 4 they checked their Mesh creation code, and it was wrong. One student wasn’t specifying the mesh as a quad (wrong input values) and both were setting the color at each vertex to completely transparent. Every time they were drawing it was invisible.
Case Study #3
A couple weeks ago a GAM150 student was requesting help with their game project. They were writing a system to specify level layouts in a text file, and they wanted to read in the file into a 2D array of C-strings. Seems simple enough.
The problem was that his double for loop that was reading in each string and copying it into a buffer was failing after the first few iterations of the loop. Since there was a lot of code and all of it was not commented, I had him set a breakpoint at the top of the function, and we walked through the function using the Step Over button. For each line of the program flow I had him explain what it was doing to me. We found the logic bug, it was another case of sizeof() on a pointer instead of using the actual size of the allocated array.
Moral of the story is that sometimes it is useful to recite your code to another person. Absent of another person you can use a rubber ducky. Yes, this is an actual thing called Rubber duck debugging.
Case Study #4
Back when I was in GAM150 (a very long time ago), my game project had a random crashing bug. This bug manifested the night before one of the presentations we were going to do. Me and my game team spent most of that night combing through the code.
While I was googling around, I found out the existence of Data breakpoints and I set one in our GameObject struct. We didn’t hide the struct using the CS230 method of C struct hiding, so in our header file the GameObject struct was defined like this:
struct GameObject
{
char name[32];
ObjectUpdateFn update;
TransformComponent transform;
RenderComponent render;
...
}
Through my debugging I found that it would only crash when the engine went through the list of objects and called their update function pointer. In our engine design, each type of object had its own update function, which in hindsight is a bad design. Don’t emulate this architecture. Anyways, whenever an object was created, I set a Data breakpoint on the update function pointer. After the normal places it was set, I found that the breakpoint was being triggered somewhere I didn’t expect.
In the enemy creation system, for debugging we were setting each enemies name like this: Enemy_[type]_[random number]. Turns out the random number generator we were using can generate very large numbers. The author of said the enemy system was not using the function I created for setting the GameObject’s name. They were using the C Standard’s strcpy() to transfer the name, ignoring the size of the name array. If the random number was large enough then that strcpy() would write into the update function pointer causing the game to crash when the game engine would call that invalid function pointer.
Further Research
If you would like to read more about the debugging tools available in Visual Studio you can visit here. For as much shit as Microsoft gets (and rightfully so) they do have good documentation.
Some of the debugging features I talked about have slightly changed in Visual Studio 2022, so I might make another article talking about the differences if I find anything cool. I still need to download and check it out sometime soon.
Conclusion
Really good debugging comes with lots of programming experience. For many of my Digipen game projects I was the graphics programmer, so for Case Study #2 I knew from experience what steps they should take for debugging. Think of debugging as an onion. Start with the more basic steps and gradually peal away into more drastic measures. Until you need to break out the holy water.
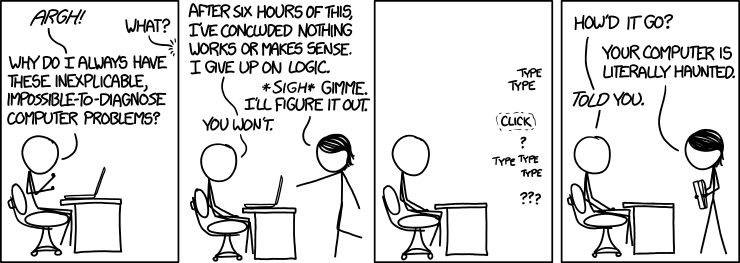
XKCD: https://xkcd.com/1316/
Author: Russell JohnsonPublished: 2022 January 29
Tags: debugging, visual-studio, c, c++